Automatic Chart Delivery and Dashboard
Automatic chart delivery by e-mail or via a public link
Enectiva allows automatic chart delivery via e-mail. The selected chart can also be shared via a public link – even with people without access to the application.
Charts are sent at 11:00 according to the selected frequency.
Creating an automatically sent chart
-
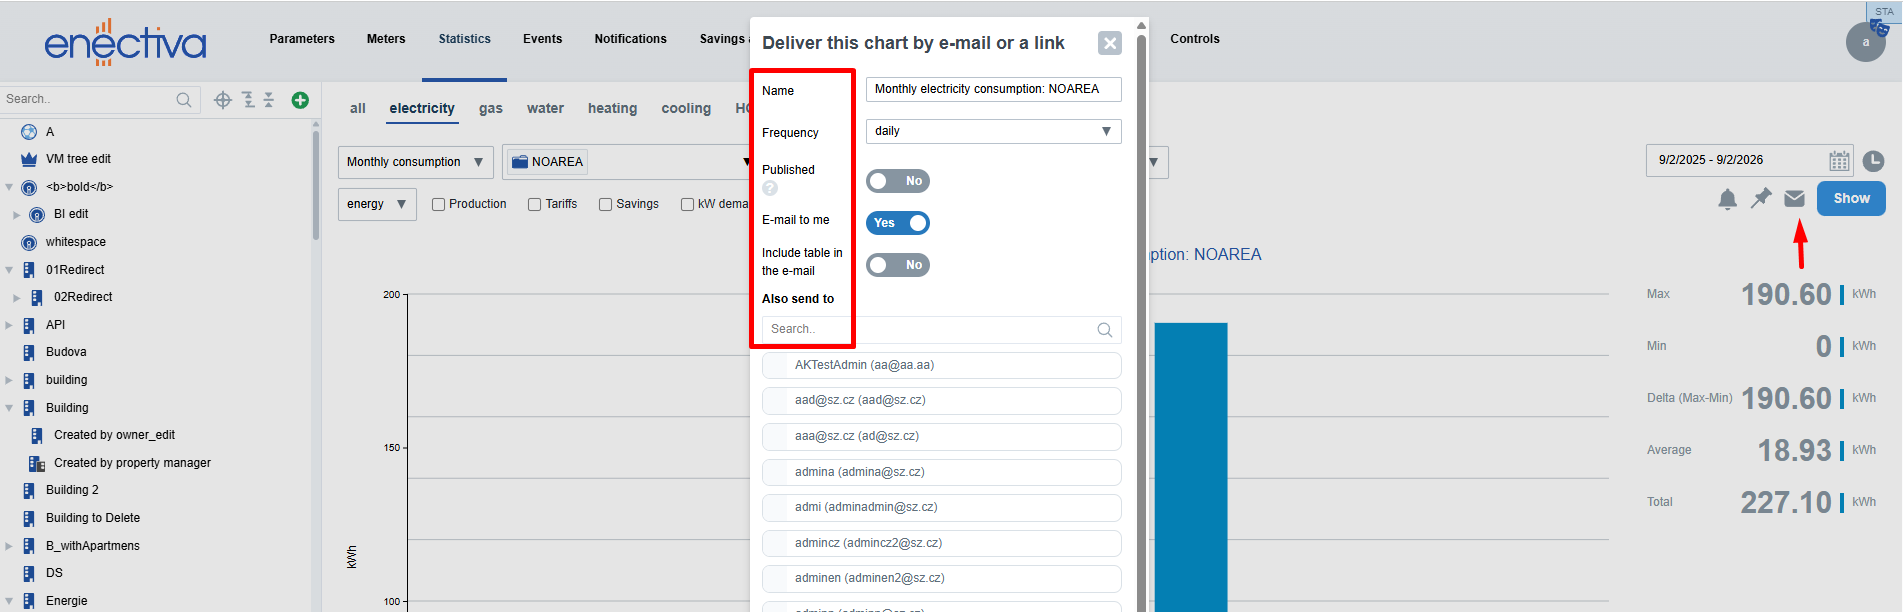
In the Statistics section, select the chart you want to send
-
Click on the envelope icon ✉ next to the Display button
-
In the opened window, configure the parameters:
- Name – pre-filled automatically, can be edited
- Frequency – how often the chart should be sent
- Published – generates a public link to the chart
- Send to my e-mail – the chart will be sent to your e-mail
- Table in e-mail – includes a table of values as an attachment
- Send also to – add other users to receive the chart
-
Click Set
If Published is selected, a link to the chart will be shown
⚠️ Keep in mind: the time period of the chart moves one day forward each day. To receive a chart with data for yesterday, set the end date of the graph to today.
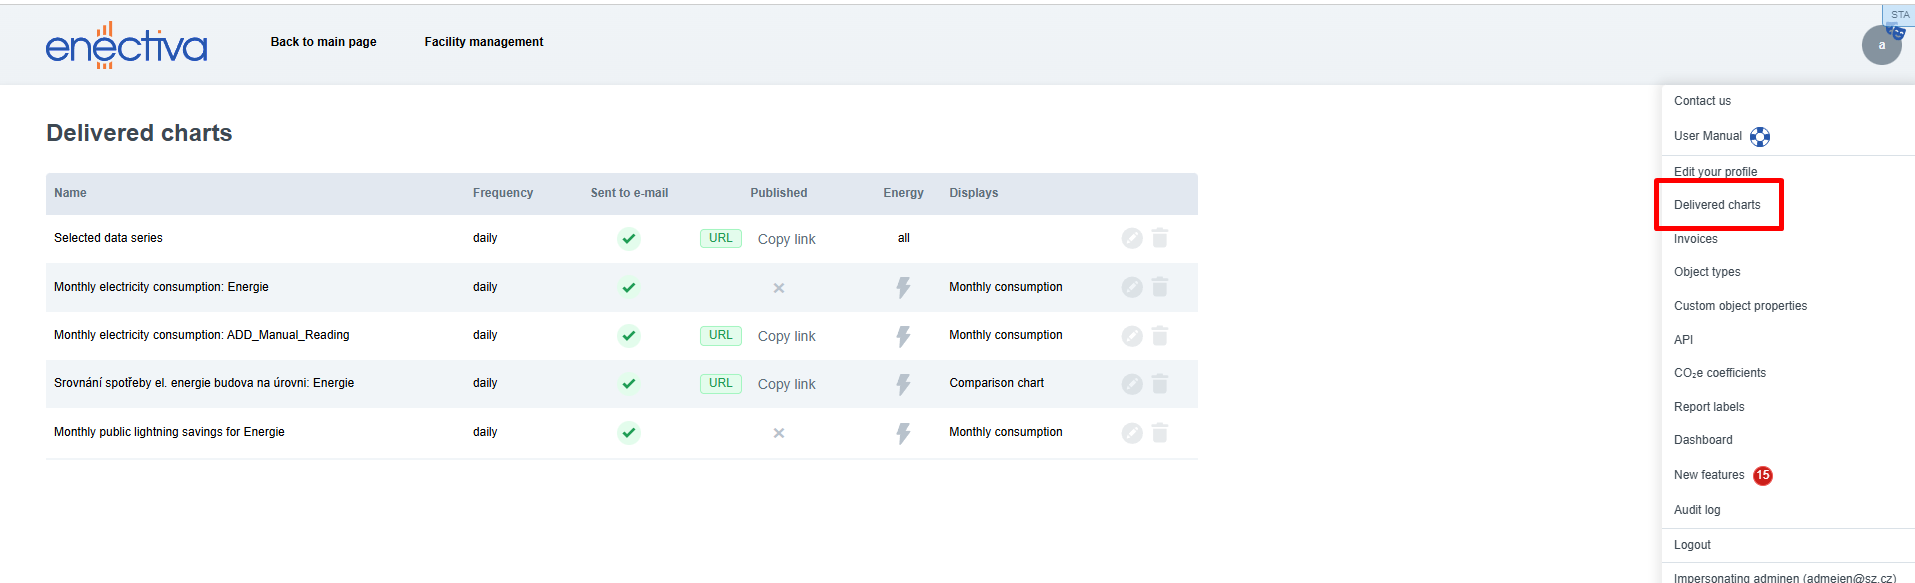
List of sent charts
To edit or remove already configured chart deliveries:
- Click your username in the top-right corner
- Select Configured charts
Dashboard charts no longer appear in this list.