Reports
Reports are intuitive graphical overviews showing consumption and potential savings.
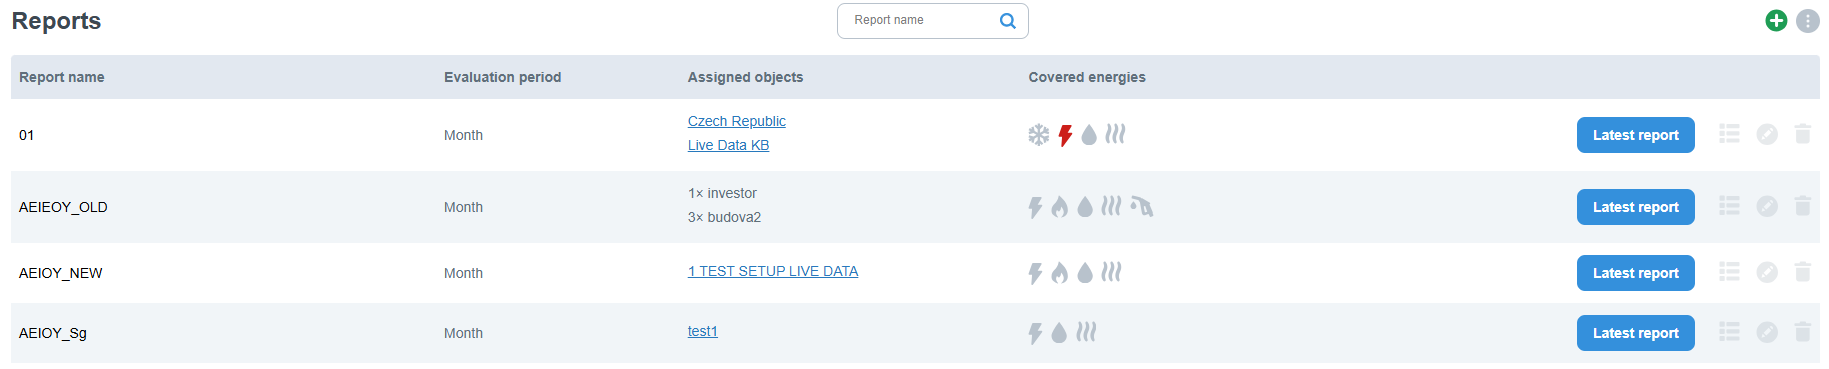
You can find them below the entity tree in the left panel. Clicking Reports opens a list of reports you can view. Full access to report configuration within the customer is available only to admin.
To create the first report, contact the IT department. Once the initial report is created, you can modify the generated reports independently.

Types of Reports
SEIEOY (Single Entity Individual Energies Over Year)
- This report is used to analyze individual energies (e.g., electricity, water, gas) consumed by a single entity over the course of a year.
- Data are presented in graphical form, typically bar charts, which may include details such as the current energy surplus or consumption levels.
- The report can be configured to exclude theoretical consumption (Tc).
SEIECYC (Single Entity Individual Energies Consumption Yearly Comparison)
- This report compares the total consumption of each energy for a single entity in the current and previous year.
- Consumption data are displayed in a dual-series column chart, where monthly values for the previous and current year are shown side by side.
- Consumption higher than in the previous year is highlighted to indicate negative trends.
- Below the chart, the report includes a consumption summary table with values for the current month and year-to-date.
AEIEOY (Aggregate Entities Individual Energies Over Year)
- This report displays the consumption from multiple entities over the course of a year.
- It can be configured to exclude theoretical consumption (Tc) and generate a report with direct values only.
Weekly/Monthly Reports
- These reports summarize energy consumption data at weekly or monthly intervals.